WG.15: Self Service Reporting using Power BI
Maybe you thought that the only thing that is better than Power BI within Excel is Power BI Online, but you are so wrong was wrong. The Power BI Desktop application that is available from the Power BI website is much better and everyone needs to use it.
The Power BI Desktop is a standalone dashboard designing tool that takes all of the great features within Excel like Power Query, PowerView, and PowerPivot and puts them in one single place to make all of your reporting a synch. And after you have finished building your dashboards, you can then publish them to the new hosted Power BI portal and create your own custom dashboards, and even perform Q&A on the data just by typing in the questions that you want answered.
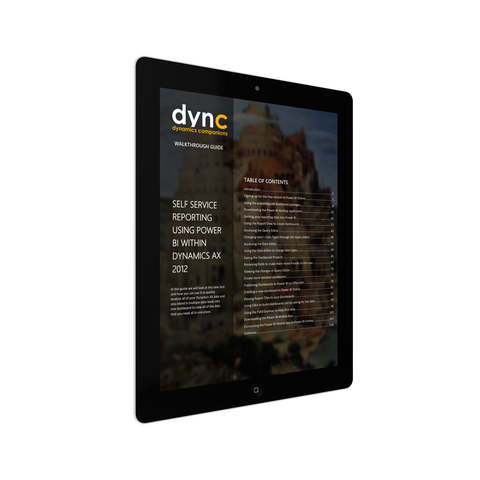
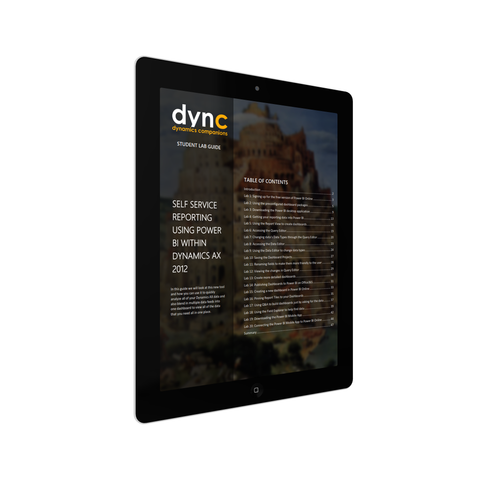
In this guide we will look at this new tool and how you can use it to quickly analyze all of your Dynamics AX data and also blend in multiple data feeds into one dashboard to view all of the data that you need all in one place.
Topics Covered
- Signing up for the free version of Power BI Online
- Using the preconfigured dashboard packages
- Downloading the Power BI desktop application
- Getting your reporting data into Power BI
- Using the Report View to create dashboards
- Accessing the Query Editor
- Changing data’s Data Types through the Query Editor
- Accessing the Data Editor
- Using the Data Editor to change data types
- Saving the Dashboard Projects
- Renaming fields to make them more friendly to the user
- Viewing the changes in Query Editor
- Create more detailed dashboards
- Publishing Dashboards to Power BI on Office365
- Creating a new dashboard in Power BI Online
- Pinning Report Tiles to your Dashboards
- Using Q&A to build dashboards just by asking for the data
- Using the Field Explorer to help find data
- Downloading the Power BI Mobile App
- Connecting the Power BI Mobile App to Power BI Online


