Embedding PowerView Dashboards within Dynamics AX Forms
Posted by Author, Curator, Visually Impared Squirrel Literacy Advocate & Dynamics AX Technical Solution Professional (TSP) at Microsoft on
PowerView is a great tool for creating dashboards and analytics for Dynamics AX, and you can easily embed it into Role Centers to create summary dashboards, and you can use it to drill into offending statistics that you notice, and you can easily create new dashboards using the new Analyze button in Dynamics AX 2012 R2. But what would be even better would be having context sensitive dashboards built into the actual master data forms. Then you would be able to see statistics and trends against the data that you a focused on. Fortunately that is not very hard to do.
In this worked example we will show how you can easily create a new dashboard through PowerView and then embed it within the Dynamics AX forms to show you just the statistics that you are looking for.
Creating a Customer Summary Dashboard
The first step in the process is to create a new PowerView Dashboard that you will embed into your master forms. Once you have done this, you can continue to tweak the view later on and not have to do any further coding.
How to do it…
To build a simple customer analysis dashboard, follow these steps:
- Start off by finding your PowerView Data Sources, and creating a new reporting canvas. In this example we will us the Sales cube as our data source.

-
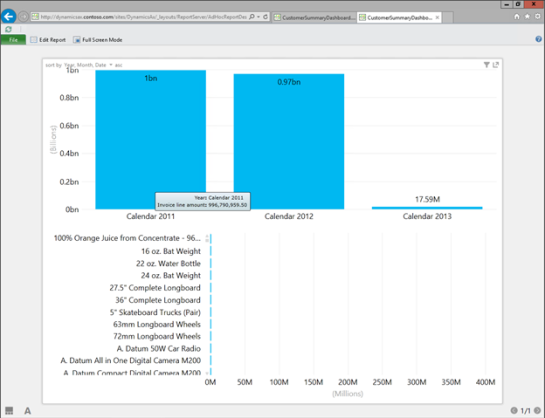
Build your dashboard from the available dimensions and measures in the cube. Here we just summarized the sales by date period, and also listed out all of the products that the customers have bought.
Note: Don’t put any filters on this form. We will apply filters in the code later on.

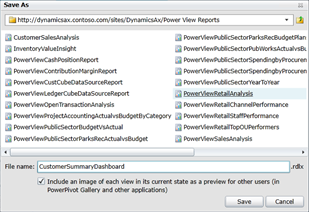
- Once you have finished building the dashboard, select the Save As option from the File menu. When the Save As dialog box shows up, give your new dashboard a name and then click the Save button.
How it works…
Now if you return to the PowerView reports library you will see the new report that you just created.

If you open it then you will see your report in view mode.
Embedding the Dashboard into the Customer Form
Once you have designed your dashboard, it is time to add it to your forms. This will allow you to browse through the records, and see statistics alongside the original field data in Dynamics AX.
Getting Ready
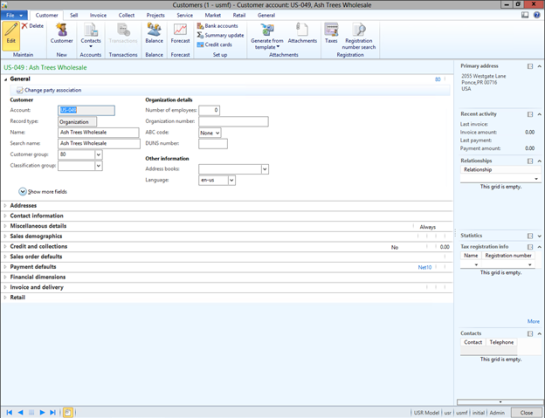
In this example we will extend out the CustTable form, which normally looks like this.
How to do it…
To add the PowerView dashboard to a form in Dynamics AX, follow these steps:
- To do this, open up the AOT, and create a new project for the change. Then copy the CustTable form over to the new project.
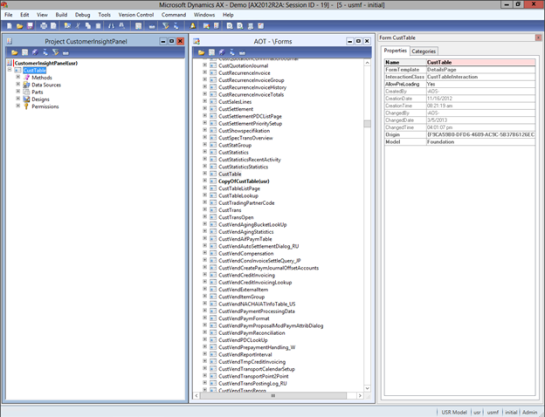
- Expand the form definition until you are able to access all of UpperGroup set of controls which houses the definition for the main form layout.

- Right-mouse click on the UpperGroup form and from the New Control sub menu, select the Group item. Rename the group, and then set the Width to 600, and the Height to 512. We do this so that you can see the dashboard when it is displayed on the form – the default sizing for the control is a little narrow.

- Then right-mouse-click on the new group that you added and select the ActiveX option from the New Control sub menu. When the ActiveX browser is displayed, find the Microsoft Web Browser control and add it to the group.
- Give your new ActiveX control a more appropriate name, and also set the Width to Column Width, and the Height to Column Height so that it fills the container.

- Now open up the Methods at the parent table level, and right-mouse-click on the Methods group. Open up the Override method sub-menu and select the activate method. When the method editor opens up, add the following lines of code.
Note: In the second line of the url variable definition, note the name of the report. This needs to match the name of the report that you created in the prior section.

If you save the project and then open up the customer form, you will see the PowerView dashboard is now shown.
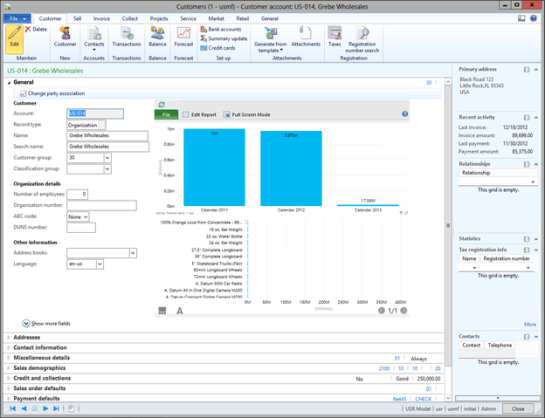
- Unfortunately this allows the user to edit the form. To fix that, update the code to include a couple more qualifiers.

Now when you open up the form, you will just see the report.

-
The final step in the process it to add some filters to the code so that it will only show the data that you selected.

Here is the complete code listing:

How it works…
Now when the dashboard is displayed, it will only show the information that relates to the current record.

How cool is that!
Summary
This was just a quick example of how you could create a PowerView report and then embed it into the Dynamics AX forms.
This is not the only place that you could do this though. If you wanted, you could create dashboards for:
- Inventory statistics and embed it within the products forms
- Vendor scorecards, and include them in the vendor records to help with negotiations
- Project status reports to help the project managers.
- Employee performance
This is a simple change to make, so give it a go.
Share this post
- 0 comment
- Tags: Dynamics AX
0 comment
