Create Reports Directly Off the Dynamics AX Cubes Through Excel
Posted by Author, Curator, Visually Impared Squirrel Literacy Advocate & Dynamics AX Technical Solution Professional (TSP) at Microsoft on
Excel is probably the number one reporting tool because it is on everyone’s computer, and also because it is so easy to manipulate the data and create your own analysis, charts and tables. In the past though, the more technical users have had a slight advantage over the general users because they knew the secret table combinations that allowed them to piece data together directly from the database, giving them better insight and reports, whilst the less technical users had to resort to cutting and pasting data, or transcribing pieces of information from other reports into Excel which made their reports tedious to build and also prone to errors.
Those days are over though because Dynamics AX comes pre-delivered with a set of reporting cubes that have already simplified and summarized the data from you and you can connect to it directly from Excel. This makes reporting so much easier for everyone, and also makes sure that everyone has the same results when they create their reports.
GETTING READY…
If this is the first time that you have connected to the Dynamics AX Cubes, then you will need to create a data connection within Excel. You will only have to do this once, because Excel will remember the connection.
To do this, select the Data ribbon bar, and click on the From Other Sources button from within the Get External Data group. From the dropdown, select the From Analysis Services menu item.
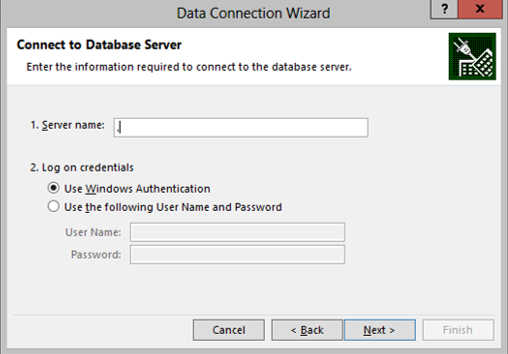
When the Data Connection Wizard dialog box is displayed, type in the name of the server where your cubes are store on, and then click on the Next button.
The next page will ask you to select the cube that you want to connect to. If you uncheck the Connect to a specific cube or table option, then you will be able to re-use this connection over and over again and connect to any of the 14 different areas without creating a new connection. To move on to the next step, click on the Next button.
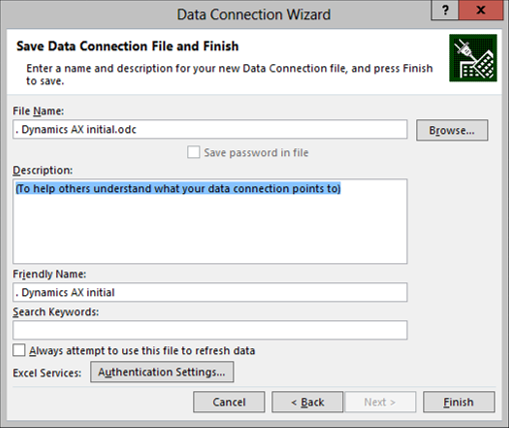
Finally, give your connection a name (or leave it as the default name) and then click on the Finish button.
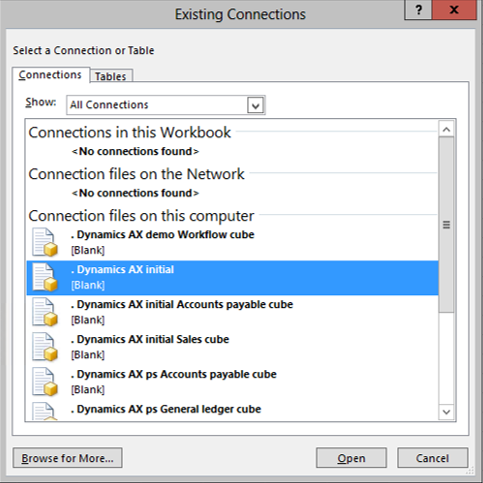
Note: The next time that you want to connect to the cubes, you will not have to go through the setup steps. All you will need to do is click on the Existing Connections button from within the Get External Data group.
This will allow you to select the connection that you created from the list of existing connections that Excel has saved away.
HOW TO DO IT…
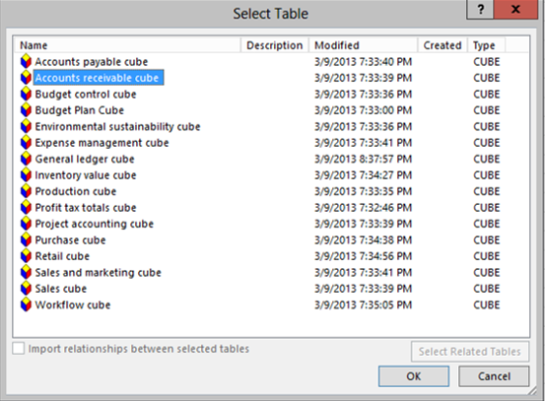
All you need to do now is select the cube that you want to create a report off, and click the OK button.
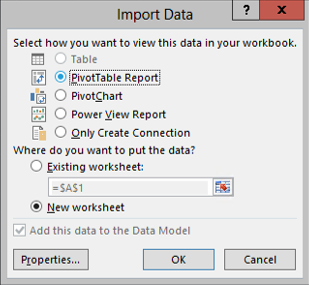
Excel will then ask you how you want to report off the data – a PivotTable Report will work fine for this example – and then click the OK button.
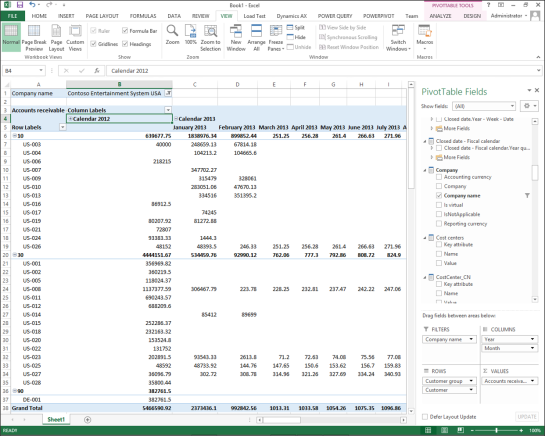
This will open up a worksheet with the blank PivotTable on the left, and all of the cube dimensions and measures on the right. All of the data has been distilled down into a set of groups and names that everyone should be able to understand.
HOW IT WORKS…
To create a report you just need to select the items that you want and add them to the PivotTable.
Share this post
- 0 comment
- Tags: Business Intelligence, Dynamics AX, Excel, Office
0 comment


