Perform What-If Analysis Within Excel using PowerBI
Posted by Author, Curator, Visually Impared Squirrel Literacy Advocate & Dynamics AX Technical Solution Professional (TSP) at Microsoft on

Perform What-If Analysis Within Excel using PowerBI
Sometimes you want to have a way to juggle numbers a little to perform quick what-if analysis, but you are not committed to the change at the time so you really don’t want to be changing the codes within Dynamics AX just yet, and would rather have the changes remain off-line until some time in the future.
In this example we will show you how to use an off-line worksheet that contains all of the changes that you want to make along with PowerPivot and PowerView to create a simple dashboard to track the impact that changes would have on your data.
GETTING READY
Before we start we will need some data to analyze. For this example we will get the backordered sales information. We made one small personalization change to the default form, and that was to add in the Customer Group, Sales Group, and Sales District for analysis.
We then just exported this information to Excel.

We will also need a worksheet that stores all of our alternate codings that we want to use for our What-If scenarios. Here we created a table that lists out all of the customers and their proposed groupings.

Once we have our Excel workbook with the linked data that we want to analyze, we will add it to a PowerPivot model by clicking on the Add to Data Model button within the Tables group of the POWERPIVOT ribbon bar.

When the PowerPivot Manager window is displayed, click on the From Other Sources button within the Get External Data group of the Home ribbon bar, and select the Excel File option so that we can link in our What-If mappings.

After choosing the worksheet that we created with the mew mappings, the data from the worksheet will be linked in with the PowerPivot model.

There is one last step that we need to perform here, and that is to link the tables. To do this, click on the Diagram View option within the View group of the Home ribbon bar and when the two tables are displayed, link them based off the Customer account. Now you can close out of the PowerPivot Manager.

Now we can return to the Excel worksheet and create a new PowerView report based of the data by clicking on the PowerView menu item within the Reports group of the Insert ribbon bar.
![]()
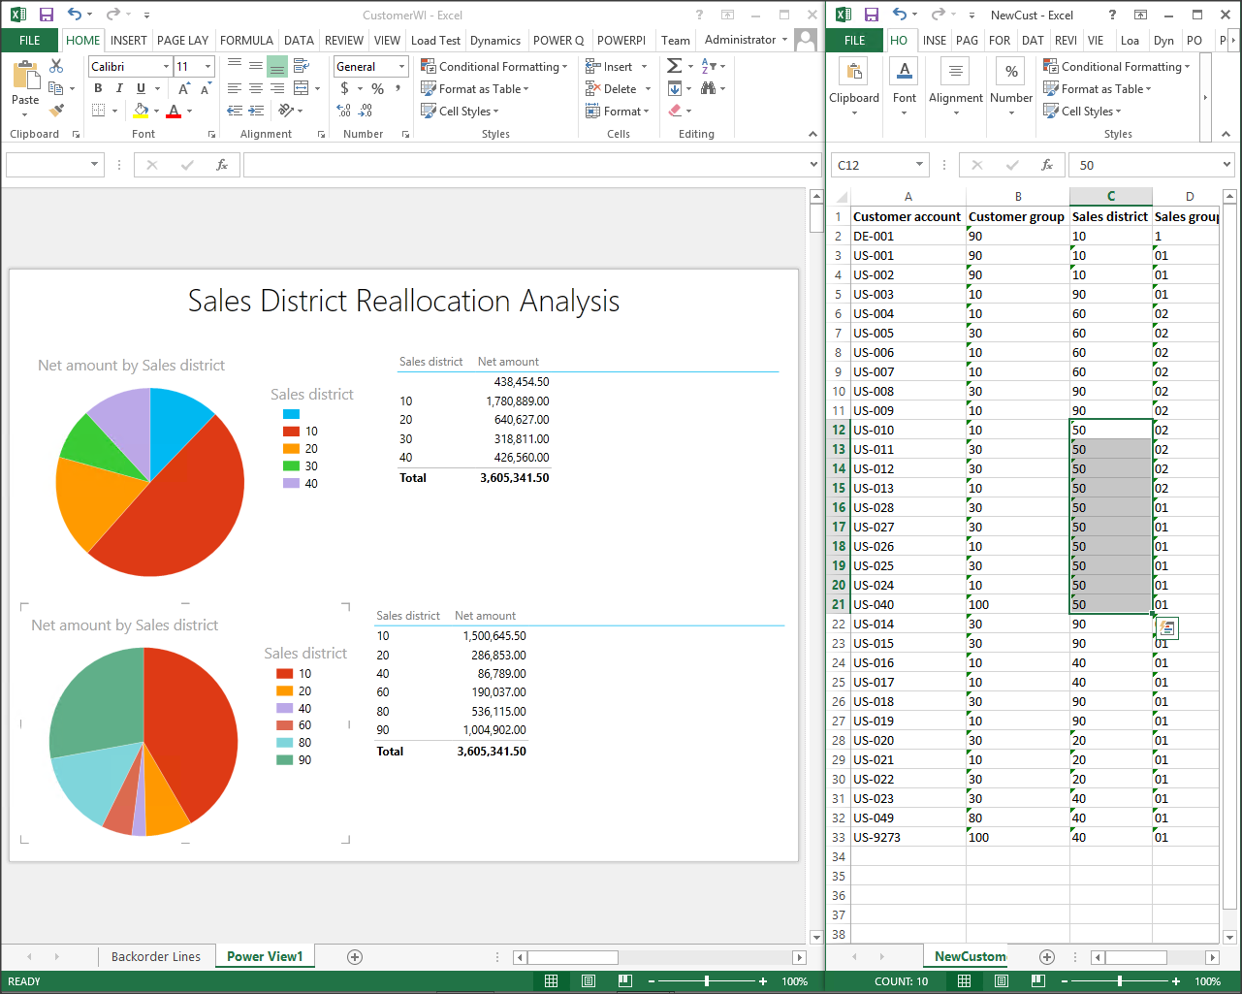
When the reporting canvas is displayed, you will be able to create a simple analysis based on the main (real) table data within the worksheet.

And you can create a second set of dashboard elements showing the data, but using the classifications that you have defined in the off-line worksheet.

HOW IT WORKS
The great thing about this is that you can change the What-If classifications within the off-line worksheet…
And if you click the Refresh button within the PowerView ribbon bar, the data will instantly change in the PowerView dashboard.


Share this post
0 comment